library(tidyverse)
library(palmerpenguins)

names(penguins)
[1] "species" "island" "bill_length_mm"
[4] "bill_depth_mm" "flipper_length_mm" "body_mass_g"
[7] "sex" "year" Week 3
library(tidyverse)
library(palmerpenguins)
names(penguins)[1] "species" "island" "bill_length_mm"
[4] "bill_depth_mm" "flipper_length_mm" "body_mass_g"
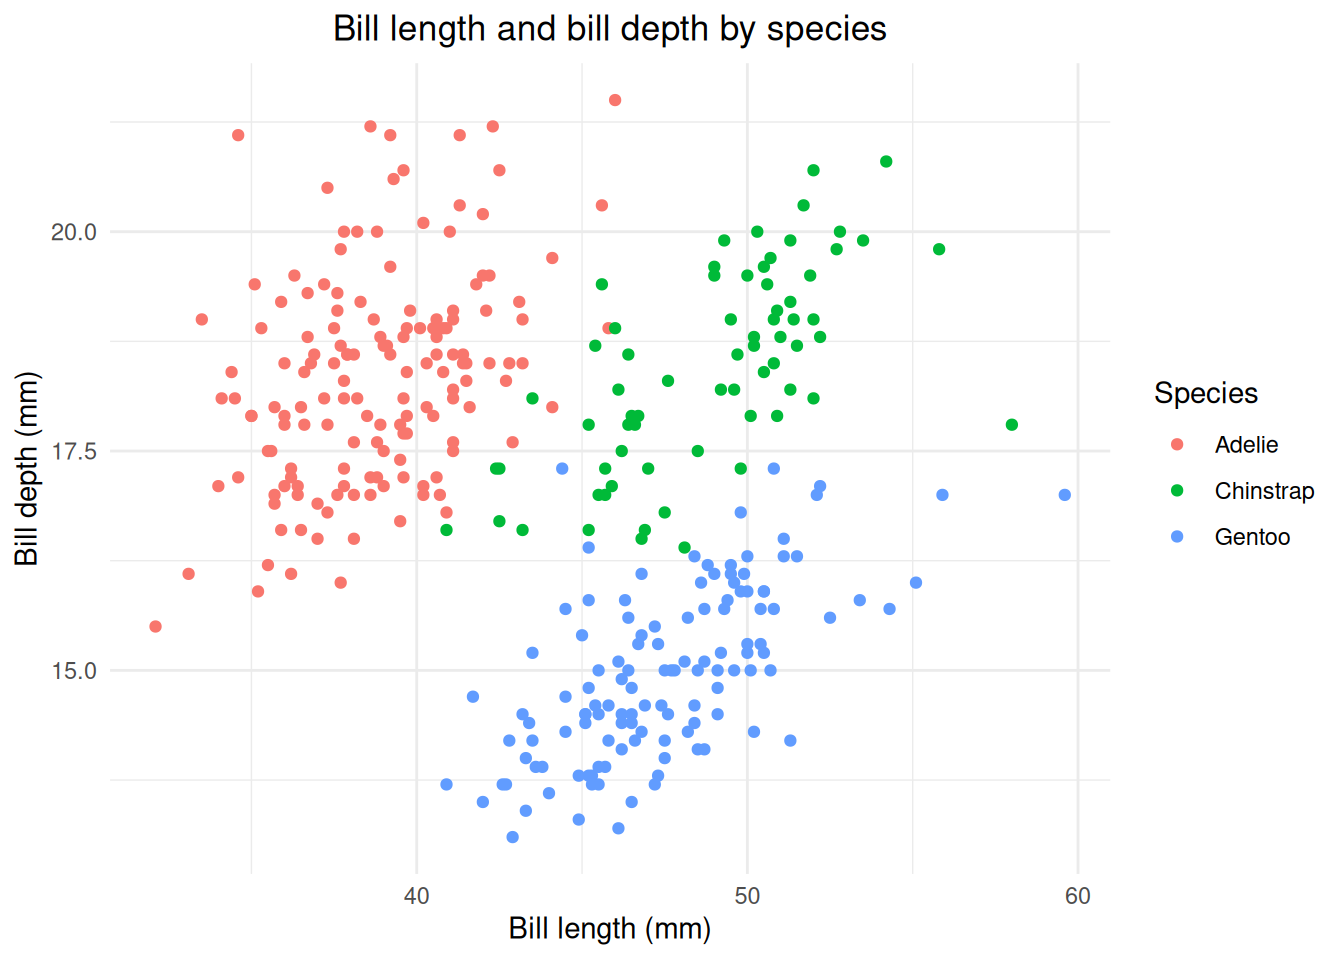
[7] "sex" "year" ggplot(
data = penguins,
mapping = aes(x = bill_length_mm, y = bill_depth_mm, color = species)
) +
geom_point() +
labs(
title = "Bill length and bill depth by species",
x = "Bill length (mm)",
y = "Bill depth (mm)",
color = "Species"
) +
theme_minimal() +
theme(
plot.title = element_text(hjust = 0.5),
plot.subtitle = element_text(hjust = 0.5)
)
theme_penguins <- function() {
  theme_minimal() +
    theme(
      plot.title.position = "plot",
      plot.title = element_text(hjust = 1),
      plot.subtitle = element_text(hjust = 1),
      legend.position = "bottom",
      panel.grid.major = element_blank(),
      panel.grid.minor = element_blank(),
      axis.line = element_line(color = "blue"),
      axis.ticks = element_line(color = "blue")
    )
}

  ggplot(
  data = penguins,
  mapping = aes(
    x = flipper_length_mm,
    y = body_mass_g,
    color = species
  )
) +
  geom_point() +
  facet_wrap(~species) +
  labs(
    title = "Penguin body mass by flipper length",
    subtitle = "Faceted by species",
    x = "Flipper length (mm)",
    y = "Body Mass (g)",
    color = "Species"
  ) +
  theme_penguins()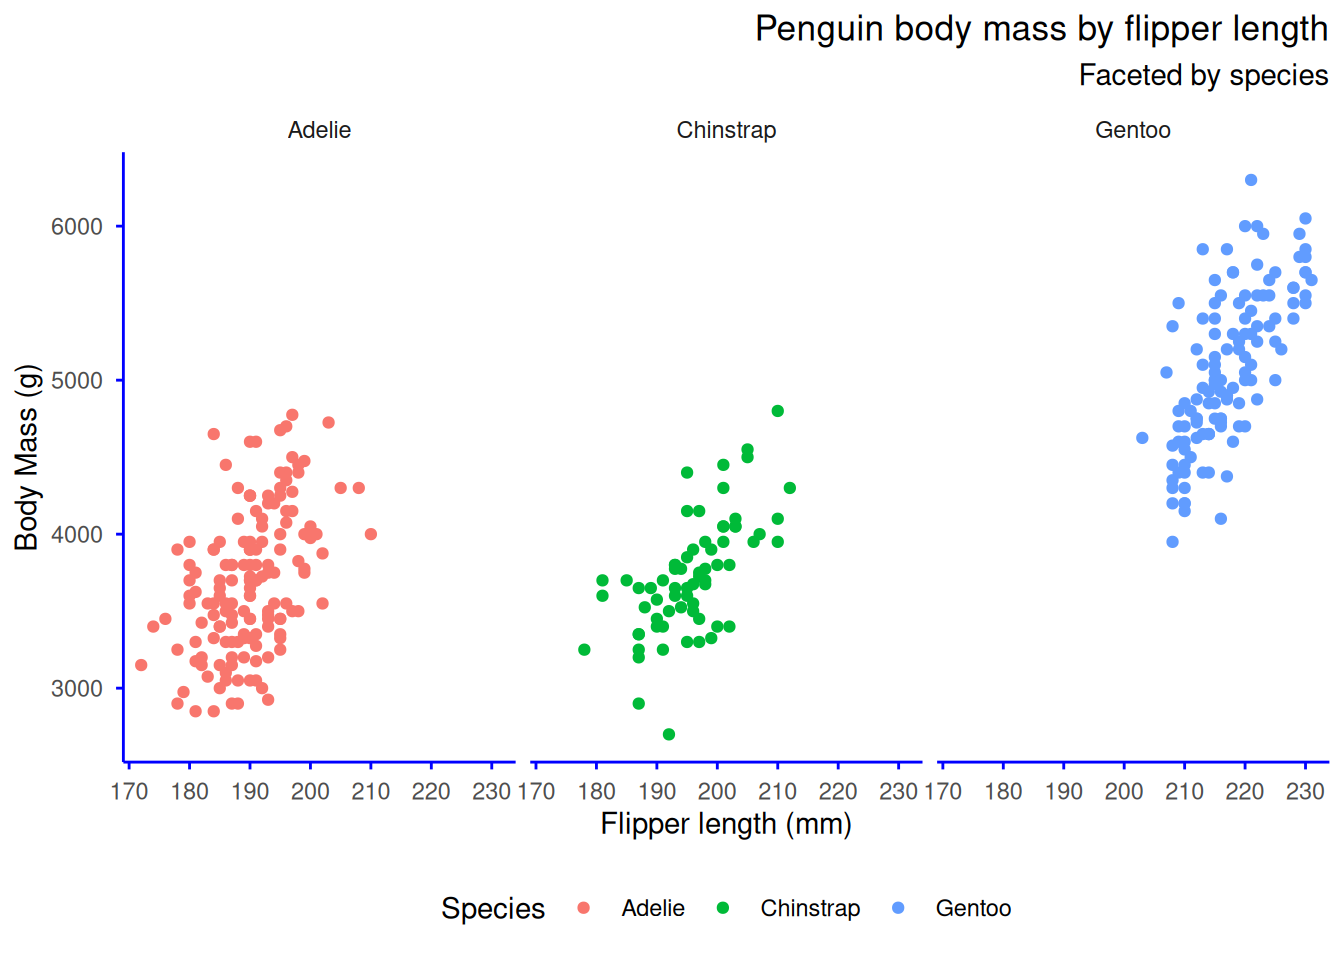
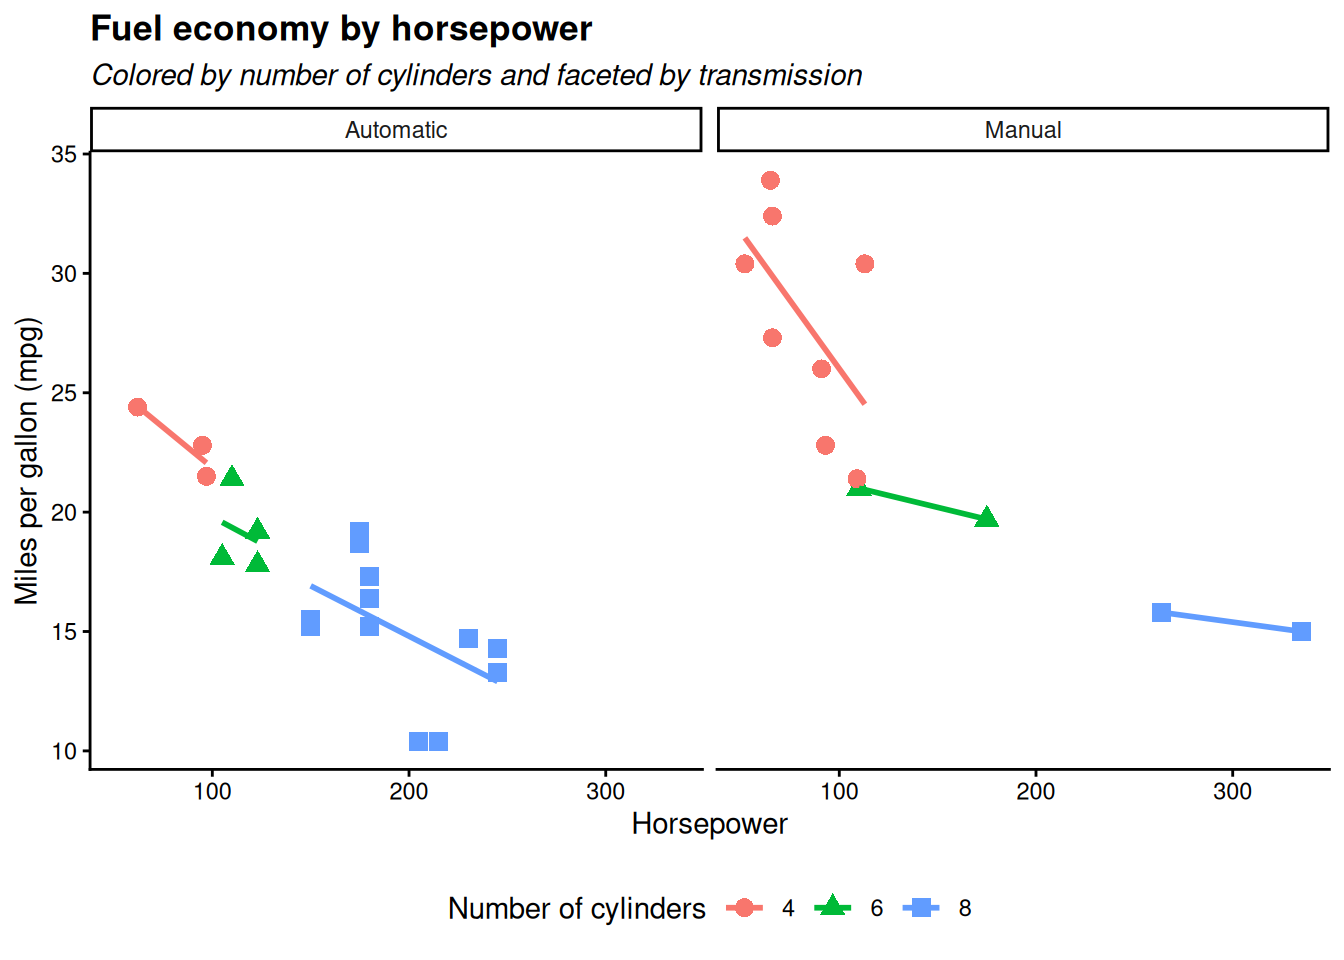
  cars_theme <- function() {
  theme_classic() +
    theme(
      legend.position = "bottom",
      plot.title = element_text(face = "bold"),
      plot.subtitle = element_text(face = "italic")
    )
}

ggplot(
  data = mtcars,
  mapping = aes(
    x = hp,
    y = mpg,
    color = factor(cyl),
    shape = factor(cyl)
  )
) +
  geom_point(size = 3) +
  geom_smooth(method = "lm", se = FALSE) +
  facet_wrap(
    ~ am,
    labeller = labeller(
      am = c(
        "0" = "Automatic",
        "1" = "Manual"
      )
    )
  ) +
  labs(
    title = "Fuel economy by horsepower",
    subtitle = "Colored by number of cylinders and faceted by transmission",
    x = "Horsepower",
    y = "Miles per gallon (mpg)",
    color = "Number of cylinders",
    shape = "Number of cylinders"
  ) +
  cars_theme()