Assignment . Practice using functionals, function factories, and function operators to improve your programming skillset.
Functionals: Run Multiple Regressions . Use a functional to fit a separate regression of mpg on each predictor. Extract the coefficient, p-value, and R2 from each model. Combine the results into a data frame showing one row per predictor.
<- c ("disp" , "hp" , "wt" , "qsec" )<- purrr:: map (predictors, \(x) {lm (reformulate (x, response = "mpg" ), data = mtcars)
[[1]]

Call:
lm(formula = reformulate(x, response = "mpg"), data = mtcars)

Coefficients:
(Intercept)         disp
   29.59985     -0.04122


[[2]]

Call:
lm(formula = reformulate(x, response = "mpg"), data = mtcars)

Coefficients:
(Intercept)           hp
   30.09886     -0.06823


[[3]]

Call:
lm(formula = reformulate(x, response = "mpg"), data = mtcars)

Coefficients:
(Intercept)           wt
     37.285       -5.344


[[4]]

Call:
lm(formula = reformulate(x, response = "mpg"), data = mtcars)

Coefficients:
(Intercept)         qsec
     -5.114        1.412
<- purrr:: map_dfr (models, \(model) {:: tidy (model) |> :: filter (term != "(Intercept)" ) |> :: select (term, estimate, p.value) |> :: mutate (r_squared = broom:: glance (model)$ r.squared)
# A tibble: 4 × 4
  term  estimate  p.value r_squared
  <chr>    <dbl>    <dbl>     <dbl>
1 disp   -0.0412 9.38e-10     0.718
2 hp     -0.0682 1.79e- 7     0.602
3 wt     -5.34   1.29e-10     0.753
4 qsec    1.41   1.71e- 2     0.175
Function Factories: Create a Model Factory . Create a function called make_modeler that takes a dataset and an outcome variable and returns a function that fits a linear model using a predictor supplied later. Use it to fit models predicting mpg and modify the returned function so it returns a tidy summary of the model rather than the entire model object.
<- function (data, outcome) {function (predictor) {<- lm (reformulate (predictor, response = outcome), data = data)<- broom:: tidy (model) |> :: filter (term != "(Intercept)" )return (tidymodel)<- make_modeler (mtcars, "mpg" ):: map_dfr (c ("wt" , "hp" , "disp" , "qsec" ), model_mpg)
# A tibble: 4 × 5
  term  estimate std.error statistic  p.value
  <chr>    <dbl>     <dbl>     <dbl>    <dbl>
1 wt     -5.34     0.559       -9.56 1.29e-10
2 hp     -0.0682   0.0101      -6.74 1.79e- 7
3 disp   -0.0412   0.00471     -8.75 9.38e-10
4 qsec    1.41     0.559        2.53 1.71e- 2
Julianne making more practice examples
library (palmerpenguins)<- function (data, outcome) {function (predictor) {<- lm (reformulate (predictor, response = outcome),data = data:: tidy (model)<- penguin_modeler (penguins, "body_mass_g" )
function (predictor)
{
    model <- lm(reformulate(predictor, response = outcome), data = data)
    broom::tidy(model)
}
<environment: 0x558f5c83bad0>
model_bill ("bill_length_mm" )
# A tibble: 2 × 5
  term           estimate std.error statistic  p.value
  <chr>             <dbl>     <dbl>     <dbl>    <dbl>
1 (Intercept)       362.     283.        1.28 2.02e- 1
2 bill_length_mm     87.4      6.40     13.7  3.81e-34
<- c ("bill_length_mm" ,"bill_depth_mm" ,"flipper_length_mm" :: map_dfr (predictors_penguin, model_bill)
# A tibble: 6 × 5
  term              estimate std.error statistic   p.value
  <chr>                <dbl>     <dbl>     <dbl>     <dbl>
1 (Intercept)          362.     283.        1.28 2.02e-  1
2 bill_length_mm        87.4      6.40     13.7  3.81e- 34
3 (Intercept)         7489.     335.       22.3  1.13e- 68
4 bill_depth_mm       -192.      19.4      -9.87 2.28e- 20
5 (Intercept)        -5781.     306.      -18.9  5.59e- 55
6 flipper_length_mm     49.7      1.52     32.7  4.37e-107
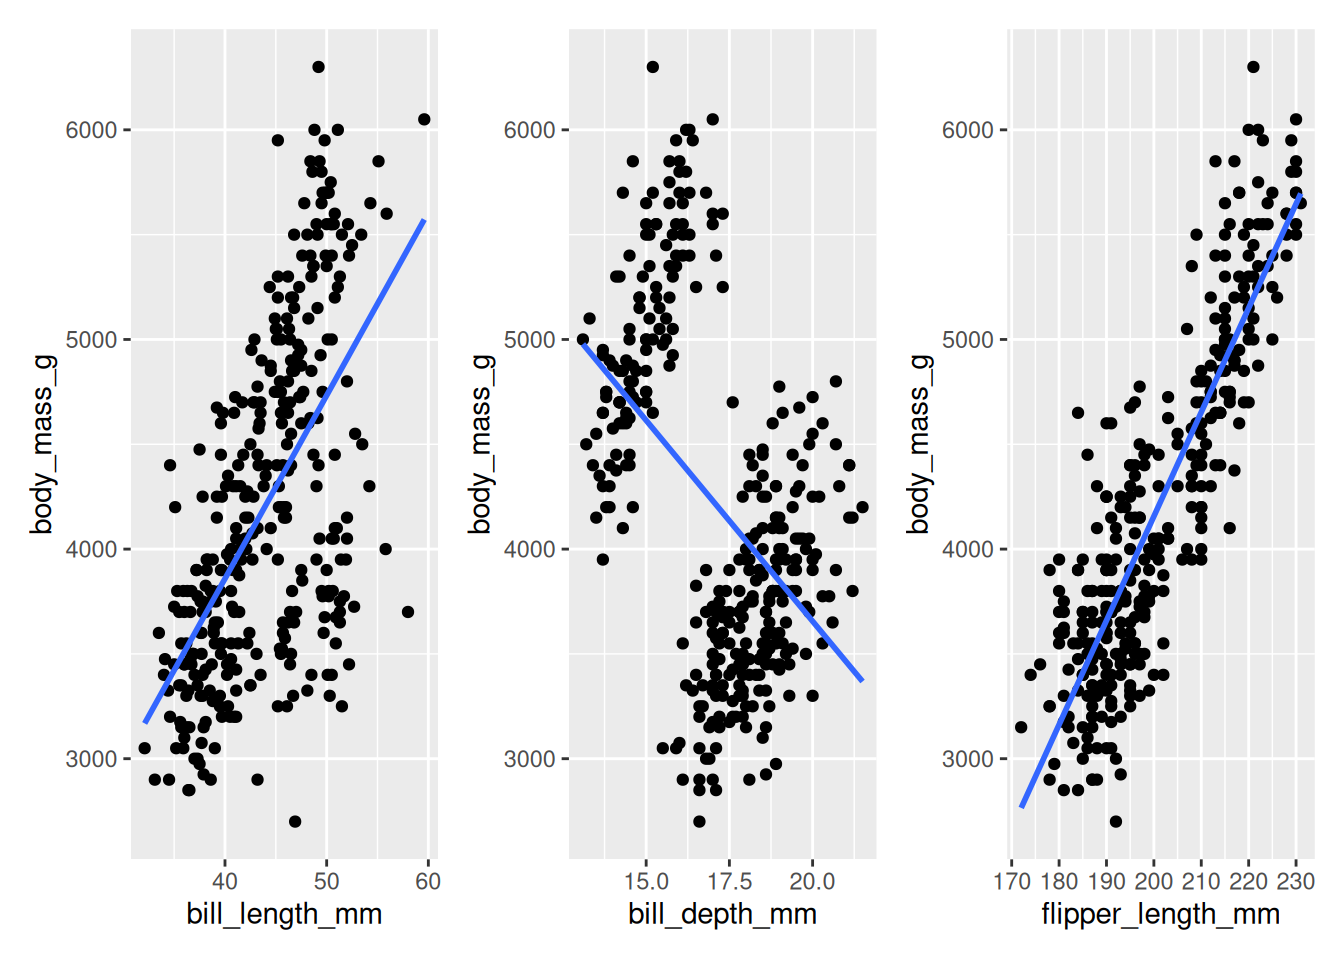
plotting practice
library (ggplot2)<- function (data, outcome) {function (predictor) {ggplot (aes (x = .data[[predictor]], y = .data[[outcome]])+ geom_point () + geom_smooth (method = "lm" , se = FALSE )<- make_plotter ("body_mass_g" <- c ("bill_length_mm" ,"bill_depth_mm" ,"flipper_length_mm" <- purrr:: map (:: wrap_plots (plots)