library(tidyverse)
library(palmerpenguins)ggplot2 Hands-On Practice: Solutions
Adjust the YAML each week when doing a new exercise
“Find the solutions to “ggplot2 Hands-On Practice” here! Please attempt all exercises on your own first, using the “Data Visualization” presentation as a guide. Use this file to check your work or debug your own code.”
Activity 1 Solution: Fill in the blanks
ggplot(
  data = penguins,
  mapping = aes(
    x = bill_length_mm,
    y = bill_depth_mm,
    color = species,
    shape = species
  )
) +
  geom_point() +
  labs(
    title = "Bill length and bill depth by species",
    x = "Bill length (mm)",
    y = "Bill depth (mm)",
    color = "Species"
  ) +
  theme_minimal()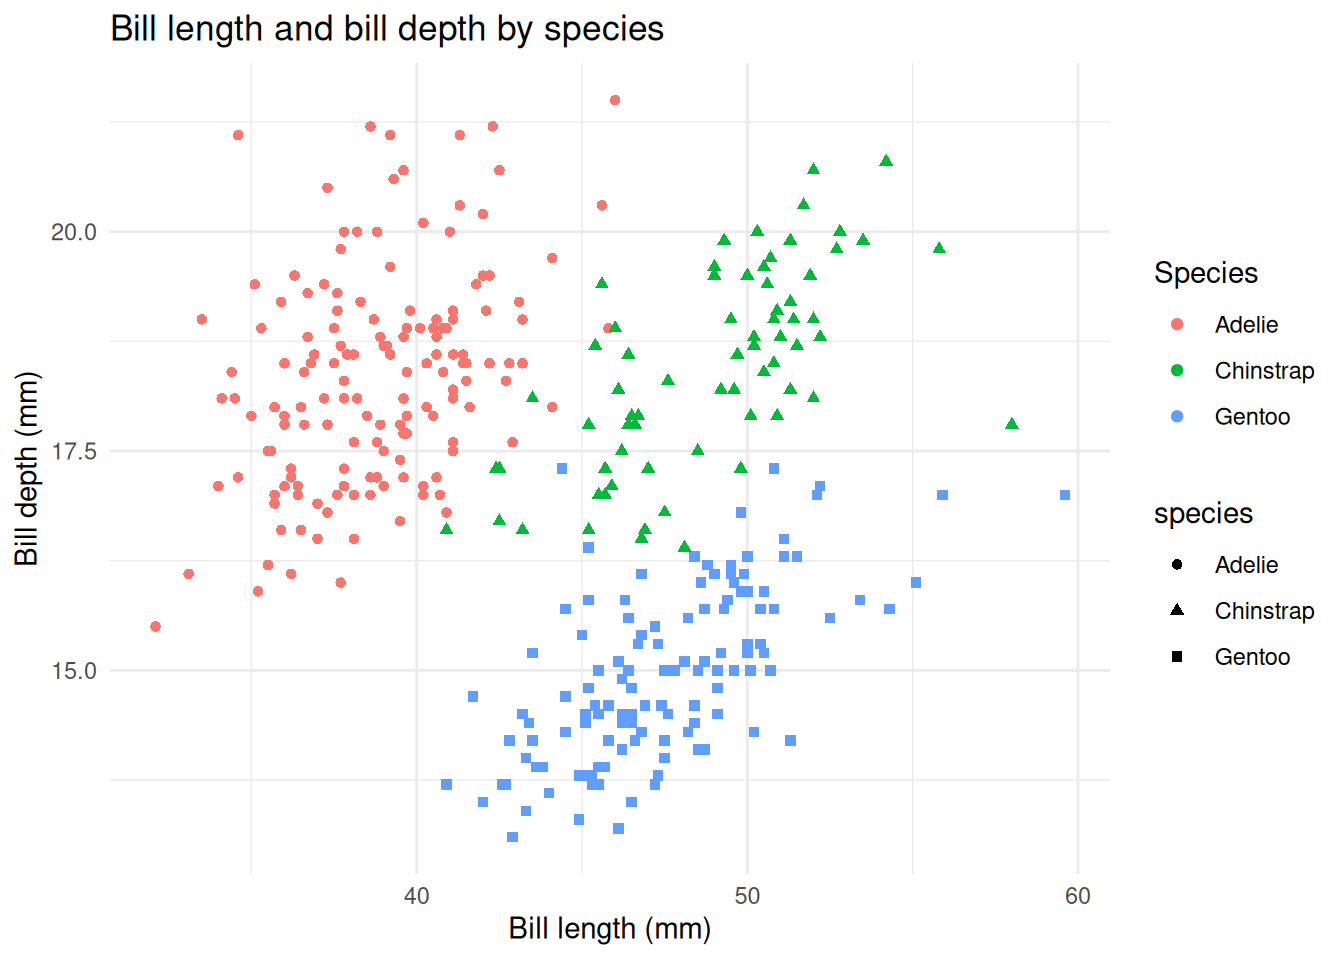
Activity 2: Update the facet plots
my.theme <- theme_minimal() +
  theme(
    plot.title = element_text(hjust = 1),
    plot.subtitle = element_text(hjust = 1),
    legend.position = "bottom",
    panel.grid.major = element_blank(),
    panel.grid.minor = element_blank(),
    axis.line = element_line(color = "blue")
  )

ggplot(
  data = penguins,
  mapping = aes(x = flipper_length_mm, y = body_mass_g, color = species)
) +
  geom_point() +
  facet_wrap(~species) +
  labs(
    title = "Penguin body mass by flipper length",
    subtitle = "Faceted by species",
    x = "Flipper length (mm)",
    y = "Body mass (g)",
    color = "Species"
  ) +
  my.theme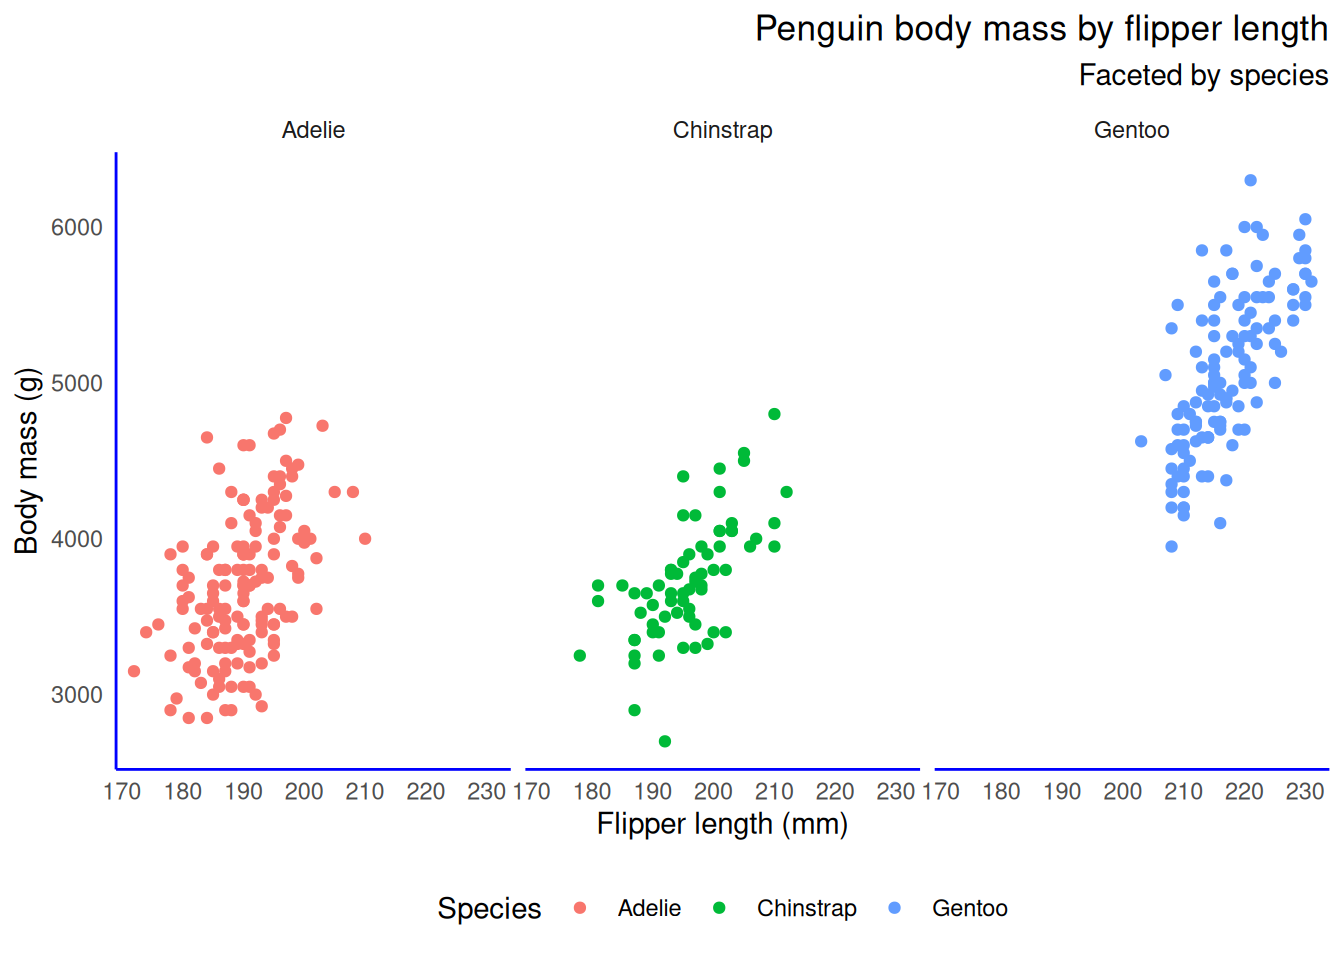
Activity 3: Create figure using new dataset
my.theme <- theme_minimal() +
  theme(
    plot.title = element_text(hjust = 0.5),
    plot.subtitle = element_text(hjust = 0.5),
    legend.position = "bottom",
    panel.grid.major = element_blank(),
    panel.grid.minor = element_blank(),
    axis.line = element_line(color = "black")
  )

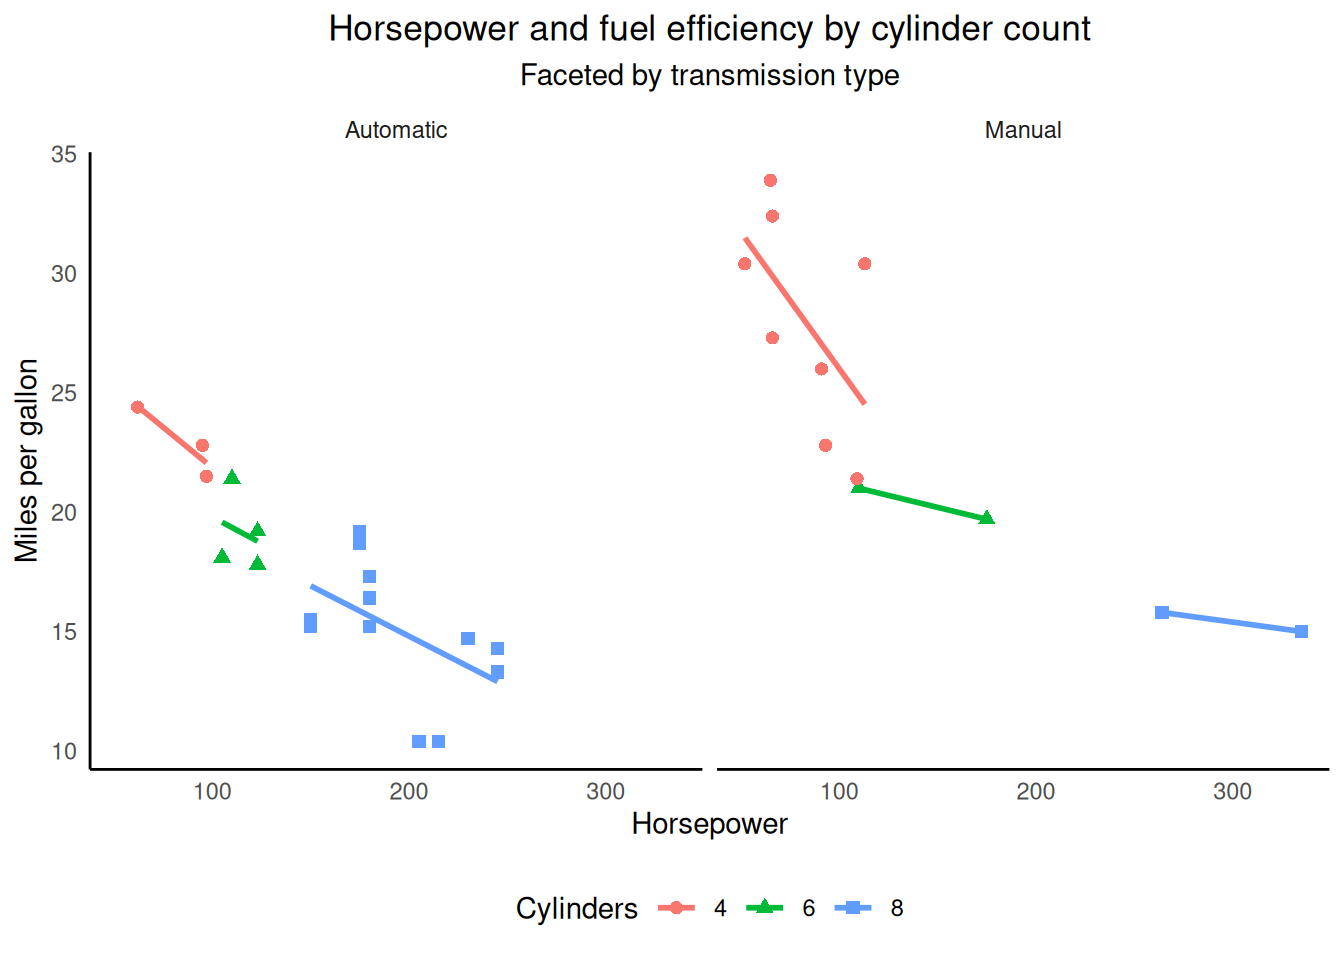
ggplot(
  data = mtcars,
  mapping = aes(x = hp, y = mpg, color = factor(cyl), shape = factor(cyl))
) +
  geom_point(size = 2) +
  geom_smooth(method = "lm", se = FALSE) +
  facet_wrap(
    ~am,
    labeller = labeller(am = c("0" = "Automatic", "1" = "Manual"))
  ) +
  labs(
    title = "Horsepower and fuel efficiency by cylinder count",
    subtitle = "Faceted by transmission type",
    x = "Horsepower",
    y = "Miles per gallon",
    color = "Cylinders",
    shape = "Cylinders"
  ) +
  my.theme